In the Control Centre their are two types of reports that can be selected and generated. These are:
- PDF Report: User selectable report pages that include energy, carbon, savings, safety and occupancy report pages.
- Excel Reports: Pre-configured excel report that includes energy savings, energy and occupancy data.
Running a Report
To run a report, navigate to the location in the Control Centre you want a report for and select the date range you wish to report on.
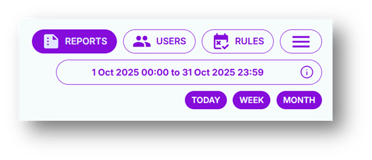
Select the REPORTS button

Choose between a pdf and excel report, make relevant selections and click generate.
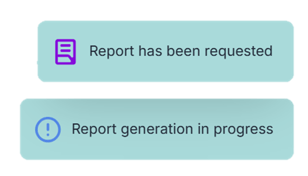
A pop up in the bottom right hand corner will show a report has been requested and is being generated.

A pop up to download the report will follow.
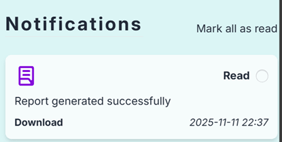
The download will also be accessible in the notifications.
PDF Reports
These are user selectable pre-configured reporting templates. They are split into relevant sections and all defined here:
| Page Option | Description |
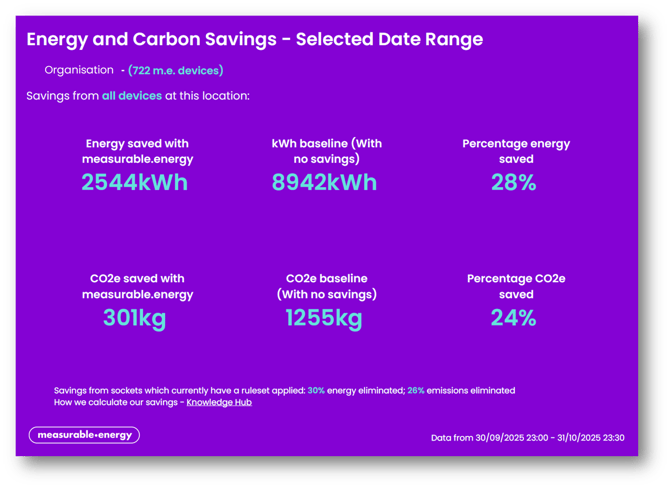
| Selected Date Range |
This will provide the energy (kWh), carbon savings (kg) and % reduction for the date range that you select in the Hub.
|
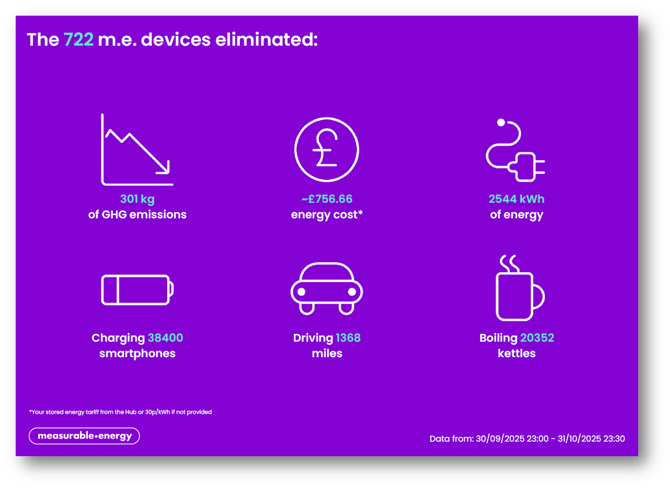
| Sustainability Conversions |
This will provide energy (kWh), energy cost (£), carbon emissions (kg) reductions and their equivalents in terms of number of phones charged, driving in miles and boiling kettles.
|
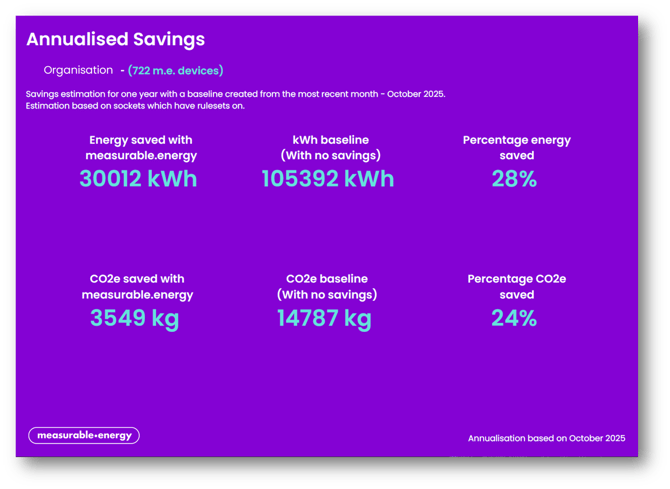
| Annualised Savings |
This will provide the energy (kWh), carbon savings (kg) and % reduction annualised from the last full month of data.
|
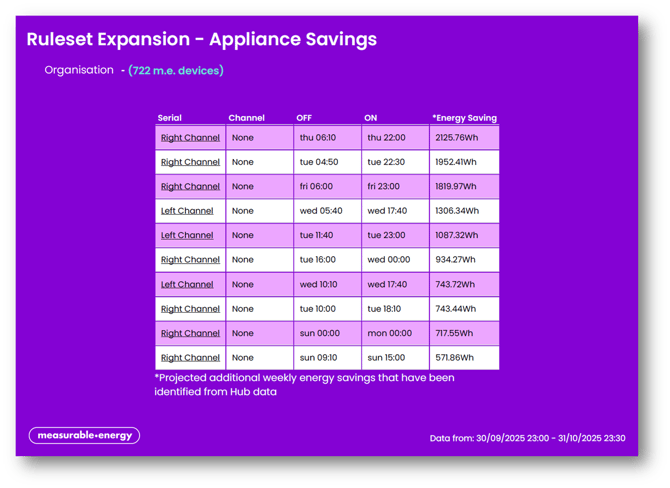
| Appliance Savings |
This will provide ruleset expansion recommendations at the individual appliance level. It will order them in terms of highest energy savings and link directly to the appliance on the Hub.
|
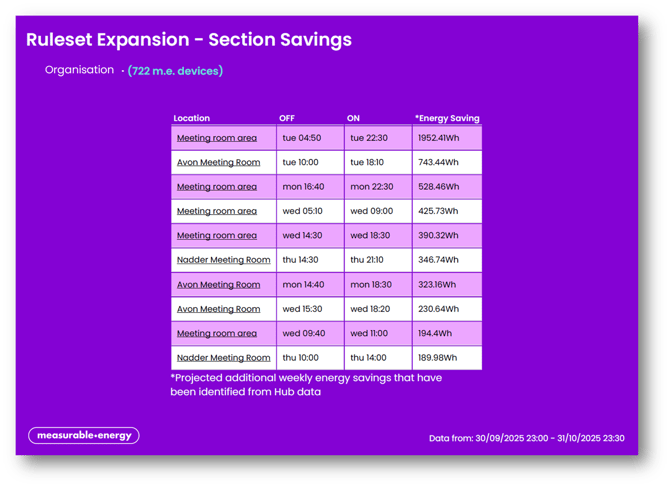
| Section Savings |
This will provide ruleset expansion recommendations at the section or room level. It will order them in terms of highest energy savings and link directly to the location on the Hub.
|
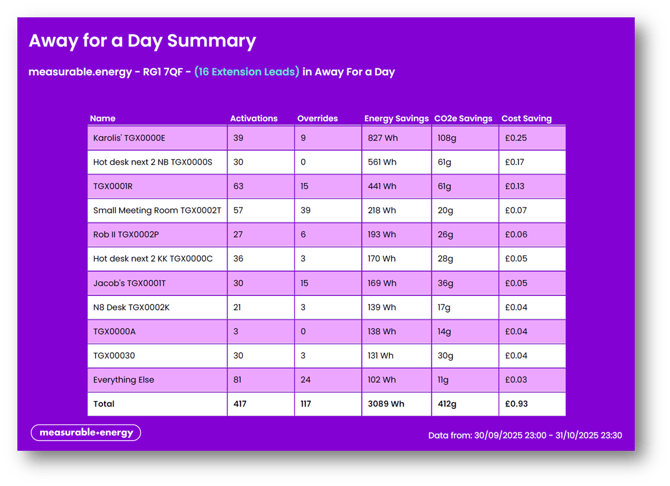
| Away for a Day |
This will summarize the energy savings that have come from using Away for a Day. The report will show the desk extension location, number of times Away for a Day activated, how many times buttons were pressed and all the energy (kWh), energy cost (£) and carbon emissions (kg) savings.
|
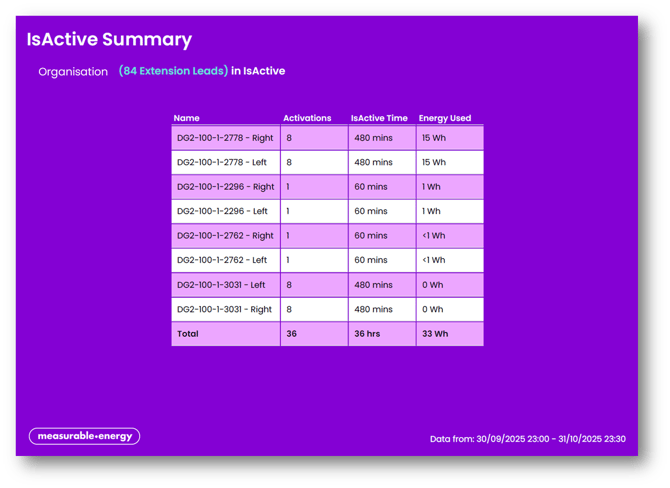
| IsActive |
This will summarize when and where IsActive has activated. It will show the location, number of activations and the energy (kWh) used.
|
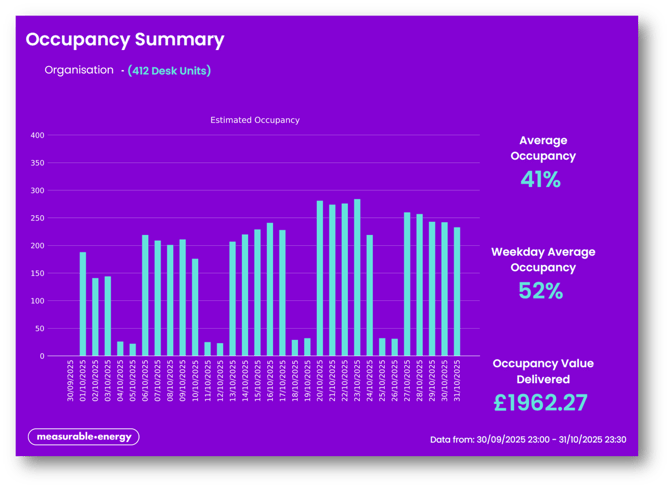
| Occupancy |
This will summarize the occupancy data visualised on the Hub. It will also provide % weekly and weekday occupancy.
|
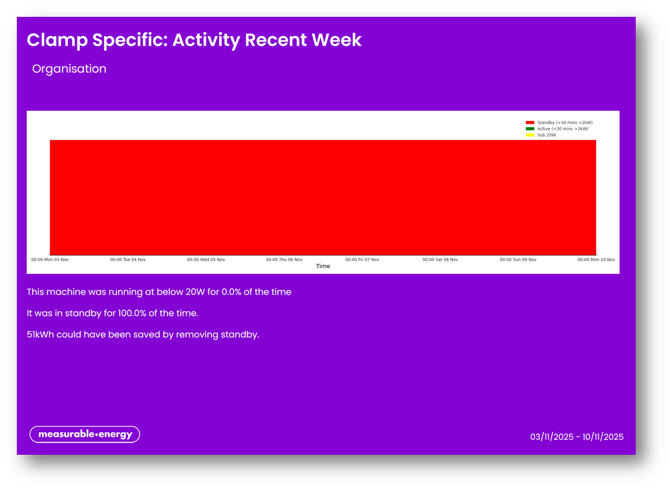
| Clamp Savings |
This is a clamp specific report that identify when industrial machinery is wasting energy in standby and therefore also wasting people time on the shop floor.
|
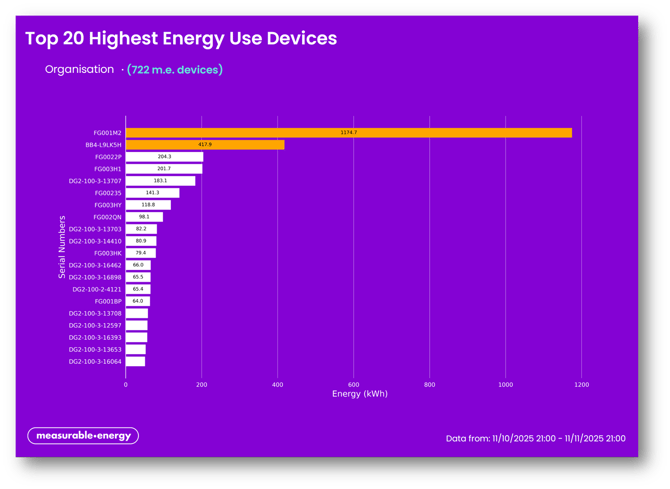
| Top 20 Appliances |
This will provide the top 20 energy use appliances over the time range selected with the view of identifying hot spots.
|
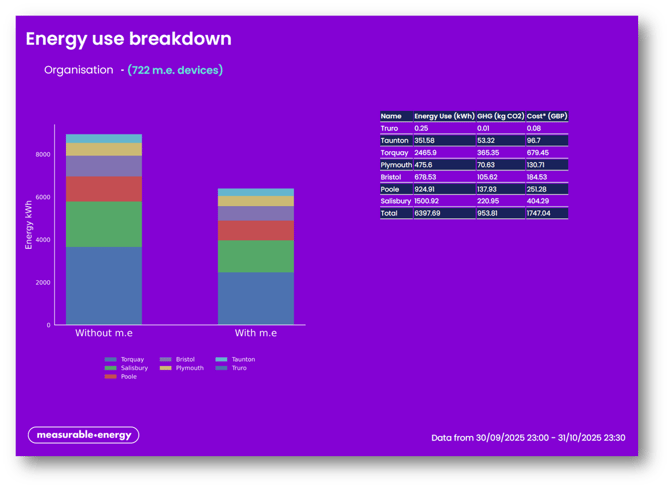
| Energy Use Breakdown |
This will provide the energy (kWh) use breakdown from the different locations underneath the level you have run the report from. It will also show the before and after energy from using the measurable.energy Platform.
|
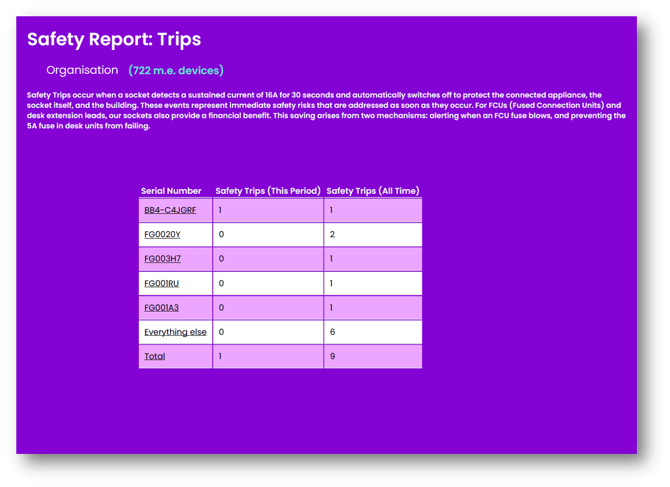
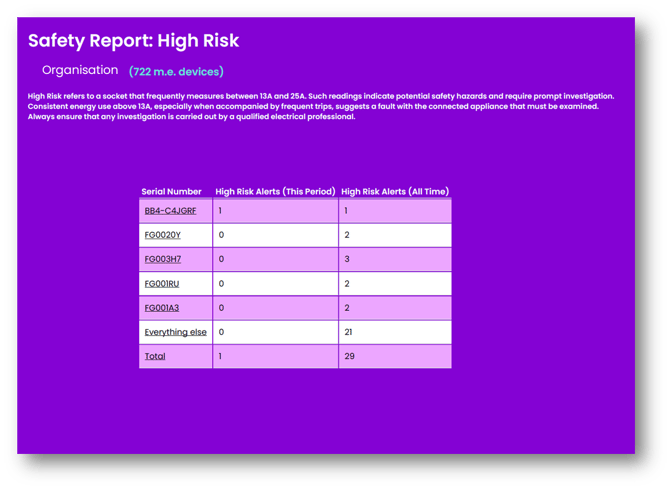
| Trips and High Risk |
This will provide two separate report pages. One that shows the sockets that have tripped and one that shows sockets that have shown above normal energy use. Full details on Trips and High Risk can be found here.
|
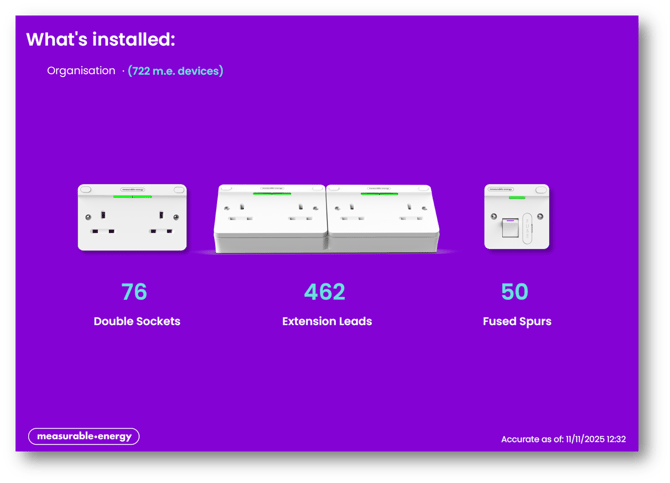
| Product Breakdown |
This page provides the split between the different measurable.energy plug sockets that have been installed: Double Sockets, Extension Leads and Fused Spurs.
|
When creating your report, select as many or as few options as required.
If there is no data to report on the pages will state this.
Excel Report
This is a preconfigured excel report page that includes:
| Tab | Description |
| Energy Data | Raw energy data from the date range selected from the Hub. The data will be displayed in the same time interval as you are viewing on the Hub. i.e. If you are looking at 30 minute data the export will be in 30 minute intervals. |
| Savings Summary |
A summary table that shows: the different socket types installed, the total number of subscriptions, energy/carbon/cost, energy/carbon/cost saved, % reductions, net cost savings and ROI. When this is run at the very top level of your organisation it will break all this information down by your sites. |
| Occupancy Data |
Raw occupancy data for alternative visualization option. |
If you wish to see data in other formats please contact you Customer Success representative or Get in Touch.