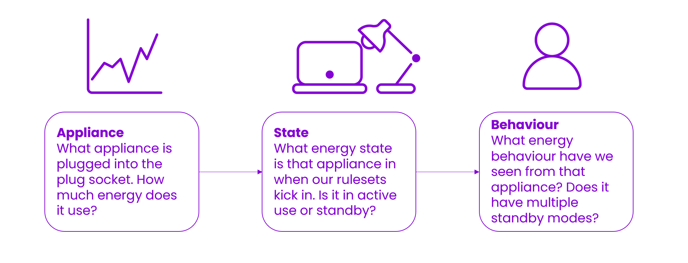
The m.e Platform uses a unique AI-driven method to forecast energy & emission savings. Traditional energy-saving systems use a baselining method where energy use over a given time period with no controls is compared to a period with controls. This method has many variables that can influence the reported savings including seasonal shifts, daily weather, occupant working patterns and appliance energy behaviour. For this reason, the measurable.energy saving methodology uses the following principles:
Using this information from our data collection we then employ the following calculation as part of a dynamic algorithm on each individual socket:
Figure 1: The measurable.energy savings forecast calculation that forms part of a comprehensive AI algorithm.
The energy output is then lined up against the carbon intensity data published by the National Grid (Carbon Intensity API) to provide an emission reduction for that period in grams/kilograms.
Figure 2: Example of how the measurable.energy saving method captures dynamic changes to savings on a daily basis.
Assumptions
As there is no means of measuring hypothetical power consumption from an appliance that has been turned off, we do the next best thing which is to predict the power consumption based data verified assumptions.
The m.e energy savings algorithm is smart enough to detect and predict savings across different appliance types. Different assumptions and rules are followed depending on the appliance:
Conventional Appliances
These include monitors, TVs, docks, laptop chargers, phone chargers, and AV equipment among others. These appliances are predominantly in standby mode when the m.e Power Socket turns off. The bulk of the energy savings come from turning off standby modes on mass. However, there are times when these appliances use active power during off times. These include:
-
Computers left on chargers after office hours
-
Monitors powering on for short periods
-
TVs receiving software updates
-
Appliances left on charge overnight
-
AV equipment left on
To account for these in a conservative and realistic manner we use a method of interpolation. This method clusters the energy data points to determine standby and active energy data points. A weighted interpolation is then made of the standby energy consumption and then applied to the timeframe the socket is turned off for.
Figure 3: Interpolation theory in action for conventional appliances
-
The above example shows a laptop and laptop charger plugged in.
-
The green dots show all the data points recorded for standby energy use. The average of this is 2.93W
-
The red colour dots show the different energy data points during the charging and use of the laptop. This energy has been grouped into 30W and 85W depending on what the laptop is doing.
-
The green dotted line shows the interpolated energy savings across the off periods at 5W.
Laptop |
Weeknights |
Weekend |
Week Total |
Month Total |
---|---|---|---|---|
2.9W |
174W |
139W |
313W |
1.2kW |
5W |
300W |
240W |
540W |
2.1kW |
Difference |
126W |
101W |
227W |
0.9kW |
The algorithm accounts for 16 hours (1.3 overnights or 0.7 weekend days) per month where the average active energy will be saved rather than the standby. At the higher end of the active energy scale this would account for 10 hours (0.8 overnights or 0.4 weekend days).
The below graph shows one of the random baseline data sets where this behaviour was captured on a weekly basis across multiple sockets.
Cyclical Appliances
These are appliances that cycle on and off and include heaters, boilers, HVAC, fridges and freezers. These appliances cycle their power modes between on and off. Energy savings from these appliances are calculated by taking an average of the on/off cycle and projecting it across the off period.
-
The above example shows a kitchen appliance with a heating element.
-
The blue bars are time periods when the socket has been turned off, hence no data and no energy use.
-
The green dots shows all the data points recorded for active energy use. The average of this is 74W
-
The green dotted line shows the energy savings across the off periods at 39W.
For these types of devices they are either cycling on or off so the projecting of energy savings is simple.
Removing the unknowns
Using this method with the two appliance profiles allows us to account for differences in daily appliance use and is not influenced by variables such as the seasons, weather changes or any changes to occupant patterns. There are however two scenarios that we cannot account for:
-
If an appliance is scheduled to turn on (with another control system) during one of our off rulesets. The appliance would have come on during this time and we have made an energy saving by keeping it off, but we cannot see it, therefore it is not reported and we underpredict the saving.
-
If an appliance is on/standby when the ruleset turns it off, but the appliance would have been controlled (with another control system) to turn off later. Learning the appliance behaviour helps us to mitigate for this but can result in an overprediction in a small number of edge cases.
The algorithms highlight sockets where it has not been possible to accurately calculate savings. These are removed from the reporting and returned when there is enough data to confirm accuracy.
It is important to note that any form of energy-saving reporting is a prediction whether it is comparing a baseline period or using AI or ML. measurable.energy are continually enhancing and optimising the algorithms we use to predict these energy savings and will update our reporting regularly to ensure that the most accurate possible predictions are always available to our customers.